1. pprof 是什么
- PProf 是用于可视化和分析性能分析数据的工具,PProf 以 profile.proto 读取分析样本的集合,并生成报告以可视化并帮助分析数据。
2. pprof 可以做什么
- CPU Profiling:CPU 分析,按照一定的频率采集所监听的应用程序 CPU(含寄存器)的使用情况,可确定应用程序在主动消耗 CPU 周期时花费时间的位置。
- Memory Profiling:内存分析,在应用程序进行堆分配时记录堆栈跟踪,用于监视当前和历史内存使用情况,以及检查内存泄漏。
- Block Profiling:阻塞分析,记录 Goroutine 阻塞等待同步(包括定时器通道)的位置,默认不开启,需要调用 runtime.SetBlockProfileRate 进行设置。
- Mutex Profiling:互斥锁分析,报告互斥锁的竞争情况,默认不开启,需要调用 runtime.SetMutexProfileFraction 进行设置。
- Goroutine Profiling: Goroutine 分析,可以对当前应用程序正在运行的 Goroutine 进行堆栈跟踪和分析
3. CPU profiling
package main

import (
	"fmt"
	_ "net/http/pprof"
	"os"
	"runtime"
	"runtime/pprof"
	"time"
)
func count() {
	a := 1
	for {
		a += 1
	}
}
func main() {
	go count()
	// 创建 CPU 性能分析文件
	f, err := os.Create("cpu.prof")
	if err != nil {
		fmt.Println("Could not create CPU profile:", err)
		return
	}
	defer f.Close()

	// 开始 CPU 性能分析
	if err := pprof.StartCPUProfile(f); err != nil {
		fmt.Println("Could not start CPU profile:", err)
		return
	}
	defer pprof.StopCPUProfile()

	// 模拟一些负载
	for i := 0; i < 10; i++ {
		time.Sleep(100 * time.Millisecond)
		fmt.Println("Run...", i)
	}
}
执行go run main.go,会生成一个cpu.prof文件。这个文件记录了程序的运行状态。使用go tool pprof cpu.prof命令分析这个文件: 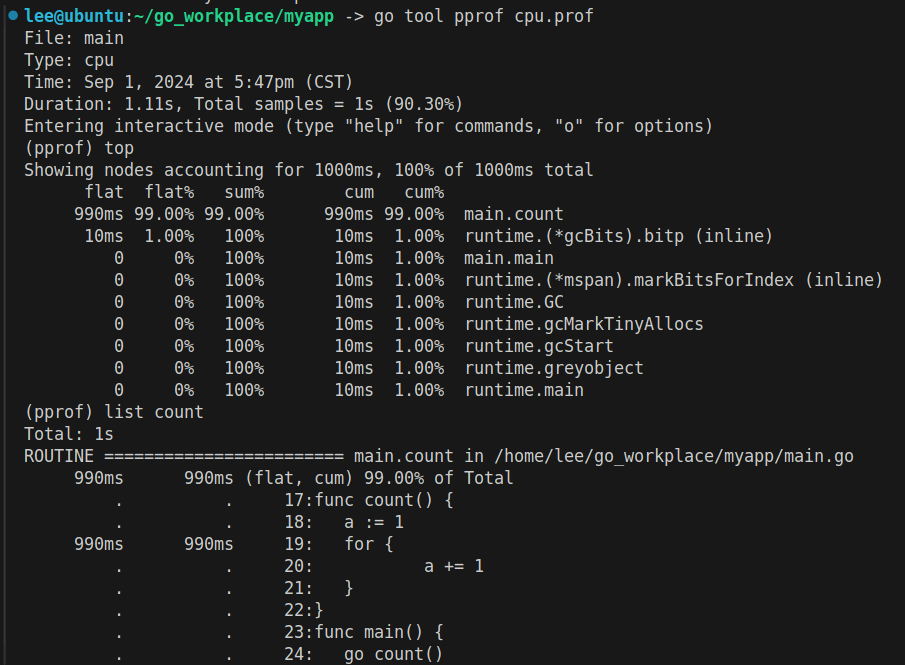 使用
使用top命令可以看到count这个函数占用了99%的时间,使用list count则可以获取到具体的占用时间的代码行,在这里是for循环
4. Memory profiling
// 创建内存性能分析文件
memFile, err := os.Create("mem.prof")
if err != nil {
	fmt.Println("Could not create memory profile:", err)
	return
}
defer memFile.Close()
使用方式是一样的go tool pprof mem.prof命令分析这个文件,可以使用top命令查看具体的占用内存的情况,然后使用list xx来查看具体的代码
5. 其他工具
5.1 flame
可以使用火焰图来帮助分析
在ubuntu上使用sudo apt install graphviz来安装必要的工具
运行命令go tool pprof -http :8080 cpu.prof则可以在网页看到具体的火焰图信息,选择如下 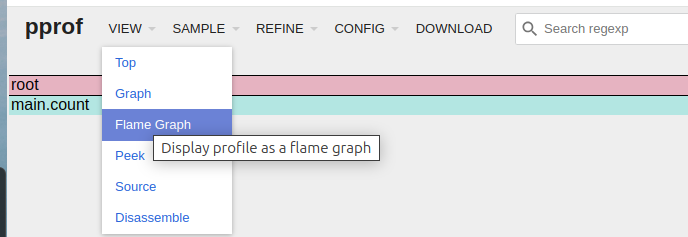
5.2 net/http/pprof
官方提供了web的分析工具
import (
  _ "net/http/pprof"
)

func NewProfileHttpServer(addr string) {
  go func() {
    log.Fatalln(http.ListenAndServe(":9999", nil))
  }()
}
运行程序go run main.go后访问本地连接http://localhost:9999/debug/pprof/则可以通过页面动态查看具体的信息